Starter Package
AWS Cost & Security Review
AWS Cost & Security Review
About
The Starter Package Cost & Security Review is designed for teams running a single primary AWS account who are seeing their cloud bill creep up without a clear explanation. If you suspect hidden waste, occasional cost spikes, or unaddressed security misconfigurations, this “sanity check” is your first step toward total cloud governance.
Fixed Price: $999 USD
What You Get
We deliver a comprehensive, executive-ready “before and after” picture of your AWS environment within a single working session.
-
Full Spend Transparency: A clear breakdown of costs by service, environment, and team in plain language.
-
Immediate Cost Recovery: Identification of the top 5–7 wasted-spend items with 12-month savings projections.
-
Security Hardening: A prioritized list of critical misconfigurations with practical, step-by-step guidance to fix them.
-
Budget Guardrails: A simple cost forecast to help finance and tech leads agree on “normal” monthly spend.
-
Executive Summary: A board-ready report pack with a “Now/Next/Later” action list for your engineering team.
Want to talk to one of our Experts Now?
Call 1800 664 222(Australia)
Call +61418222415(Outside Australia)
Cost Reports

This dashboard ensures that Cloud Costs only make sense when they are actionable. By seeing your “Account Summary” next to your “Savings Plan Coverage,” you aren’t just looking at a bill—you are looking at a roadmap for your next $10,000 in savings.
You get a report that answers three questions at a glance:
-
Financial Guardianship: You get a single pane of glass that bridges the gap between your engineering usage and your finance department’s commitments.
-
Predictive Budgeting: You get sophisticated forecasting that compares accrued costs against month-end projections, eliminating “bill shock” forever.
-
Environment Accountability: You get granular breakdowns by account (Acme, Production, Logs) so you can hold specific teams accountable for their cloud consumption patterns.

This dashboard ensures that your cloud growth is intentional, not accidental. By visualizing daily “All Resource” volatility alongside “Quarterly Service” trends, you move from reactive troubleshooting to long-term cost mastery.
You get a report that answers three key questions at a glance:
-
Volatility Detection: You get high-resolution daily tracking that exposes hidden cost spikes, allowing you to identify exactly when and why your spending deviated from the norm.
-
Structural Awareness: You get a macro-level view of your top service drivers (ECS, RDS, Redshift) so you can see which parts of your infrastructure are scaling and which are becoming inefficient.
-
Strategic Benchmarking: You get six months of historical data to serve as a “true” baseline, making it easy to prove the ROI of your optimization efforts to stakeholders.

This dashboard ensures that your cloud strategy is business-aligned, not just infrastructure-heavy. By consolidating AWS, and Snowflake spend alongside per-unit automation costs, you see the true ROI of every dollar invested.
You get a report that answers three questions at a glance:
-
Multi-Provider Consolidation: You get a single source of truth for your entire stack, from core cloud (AWS/Azure) to specialized data platforms (Snowflake/Datadog), removing the need to reconcile dozens of individual invoices.
-
Unit Cost Intelligence: You get “Cost per Automation” metrics that translate abstract cloud spend into business value, allowing you to track how efficiently your infrastructure supports your core operations.
-
Effective Savings Management: You get deep visibility into your “Effective Savings Rate” and “Financial Commitments,” ensuring that your mix of Spot, RIs, and Savings Plans is always optimized for the highest possible discount.
Security Reports
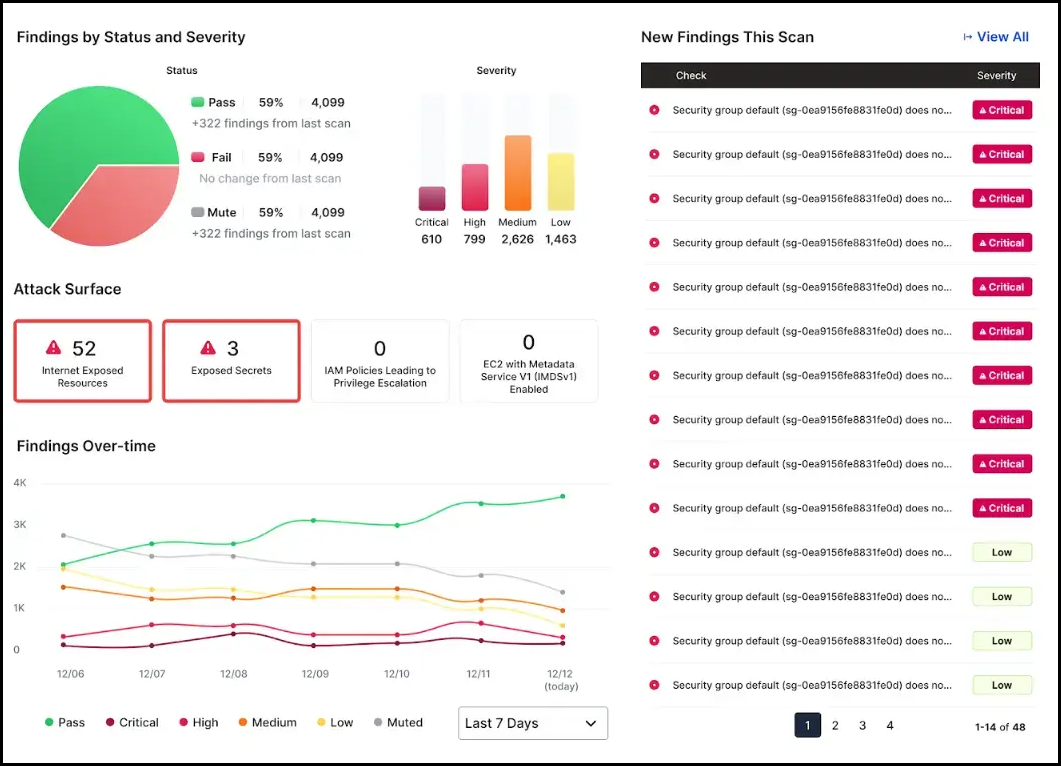
This dashboard ensures that your security posture is proactive, not just compliant. By ranking findings by severity and exposure, you empower your team to fix what matters most, protecting your infrastructure before a risk becomes a breach.
You get a roadmap that prioritizes your next three moves:
-
Neutralize the Attack Surface: Instantly identify and close the 52 internet-exposed resources and 3 leaked secrets that represent your highest immediate risk.
-
Focus on Critical Remediation: Cut through the noise of 5,000+ total findings to focus your engineering team exclusively on the 610 “Critical” vulnerabilities that threaten your core infrastructure.
-
Track Security Velocity: Monitor the “Findings Over-time” trend to ensure your team is resolving vulnerabilities faster than new ones are discovered.

This dashboard ensures that your security strategy is globally coordinated. By pinpointing exactly which regions and accounts are “lighting up” with new findings, you can deploy remediation resources where they are needed most, rather than guessing where the risk is.
You get a roadmap that prioritizes your next three moves:
-
Isolate Regional Hotspots: Use the global map to identify if a surge in “New” findings is concentrated in a specific geography like US-Central1, allowing you to investigate regional misconfigurations immediately.
-
Enforce Account Accountability: Rank your top 10 failed accounts by severity—such as Alias (primary) or DevE—to hold specific business units accountable for their individual security hygiene.
-
Identify Service Patterns: Analyze which core services, such as Cloudtrail or EC2, are responsible for the highest volume of failed checks (e.g., 12,234 fails) to address systemic architectural weaknesses.

This dashboard ensures that your compliance status is always current, not just a once-a-year effort. By bringing together all key frameworks in a single row of scorecards, you can demonstrate improvement to auditors and customers in seconds.
You get a roadmap that prioritizes your next three moves:
-
Audit-Ready Global Visibility: Instantly view your rating across CIS, SOC 2, ISO 27001, and HIPAA in one place, ensuring you meet the diverse requirements of your global customers.
-
Identify Compliance Drift: Spot immediate drops in your score, such as the -62% plunge in the “General Spanish Security National Scheme,” allowing you to investigate and fix recent environmental changes before an auditor finds them.
-
Track Remediation Progress: Measure the success of your engineering efforts with “Change from last scan” metrics (e.g., +12% improvements), proving that your organization is actively hardening its posture.