Growth Package
AWS Cost & Security Deep-Dive
AWS Cost & Security Deep-Dive
About
The Growth Package AWS Cost & Security Deep-Dive is ideal for organizations running several AWS accounts that want one trusted view of spend and risk plus an optimization roadmap. If your environment has grown beyond a single account and you need granular ownership mapping, structural savings identification, and a rigorous compliance register, this is your definitive solution for total cloud governance.
Fixed Price: $3,500
Click Order Package Now to pay a small deposit or schedule a quick setup call.
We’ll confirm scope, dates, and payment before anything is final.
What You Get
We deliver a comprehensive, executive-ready “before and after” picture of your AWS environment across multiple accounts, including a detailed remediation backlog.
-
Multi-Account Spend Transparency: A single, consolidated view of spend and risk across all in-scope accounts, mapped to products, teams, and environments for crystal clear ownership.
-
Structural Savings Roadmap: Identification of rightsizing, storage, and commitment opportunities ranked by impact, with quantified low/medium/high 12-month savings scenarios.
-
Advanced Anomaly Detection: Identification of recurring anomalies and “noisy” spend drivers, providing the recommendations needed to stabilize your monthly bill.
-
Security Maturity & Compliance: A security maturity score for each account, an overall target state analysis, and a full risk/compliance register showing affected systems and recommended controls.
-
Execution-Ready Backlog: A detailed remediation backlog for cost and security with defined owners, timelines, and effort levels to ensure actions are taken.
-
Board-Ready Reporting & Implementation: Choice of either a 90-day board-ready roadmap or high-priority fix implementation, plus two working sessions to translate results into Jira/Asana tickets.
Why Choose the Growth Package
- Eliminates data silos
- Provides single pane of glass for billing and risk
- Identifies cross-account optimization opportunities
- Simplifies cost allocation and chargeback
- Typical clients see 20-35% cost reduction
- Savings compound across multiple accounts
- Enterprise-scale Reserved Instance optimization
- Identifies unused resources at scale
- Security maturity scoring identifies control gaps
- Compliance register prioritizes remediation
- Risk-weighted recommendations
- Supports audit and governance requirements
- Phased implementation plan with milestones
- Clear ownership and effort estimation
- Integration with Jira/Asana/ServiceNow
- Measurable cost and security KPIs
Cost Reports

This dashboard ensures that Cloud Costs only make sense when they are actionable. By seeing your “Account Summary” next to your “Savings Plan Coverage,” you aren’t just looking at a bill—you are looking at a roadmap for your next $10,000 in savings.
You get a report that answers three questions at a glance:
-
Financial Guardianship: You get a single pane of glass that bridges the gap between your engineering usage and your finance department’s commitments.
-
Predictive Budgeting: You get sophisticated forecasting that compares accrued costs against month-end projections, eliminating “bill shock” forever.
-
Environment Accountability: You get granular breakdowns by account (Acme, Production, Logs) so you can hold specific teams accountable for their cloud consumption patterns.

This dashboard ensures that your cloud growth is intentional, not accidental. By visualizing daily “All Resource” volatility alongside “Quarterly Service” trends, you move from reactive troubleshooting to long-term cost mastery.
You get a report that answers three key questions at a glance:
-
Volatility Detection: You get high-resolution daily tracking that exposes hidden cost spikes, allowing you to identify exactly when and why your spending deviated from the norm.
-
Structural Awareness: You get a macro-level view of your top service drivers (ECS, RDS, Redshift) so you can see which parts of your infrastructure are scaling and which are becoming inefficient.
-
Strategic Benchmarking: You get six months of historical data to serve as a “true” baseline, making it easy to prove the ROI of your optimization efforts to stakeholders.

This dashboard ensures that your cloud strategy is business-aligned, not just infrastructure-heavy. By consolidating AWS, and Snowflake spend alongside per-unit automation costs, you see the true ROI of every dollar invested.
You get a report that answers three questions at a glance:
-
Multi-Provider Consolidation: You get a single source of truth for your entire stack, from core cloud (AWS/Azure) to specialized data platforms (Snowflake/Datadog), removing the need to reconcile dozens of individual invoices.
-
Unit Cost Intelligence: You get “Cost per Automation” metrics that translate abstract cloud spend into business value, allowing you to track how efficiently your infrastructure supports your core operations.
-
Effective Savings Management: You get deep visibility into your “Effective Savings Rate” and “Financial Commitments,” ensuring that your mix of Spot, RIs, and Savings Plans is always optimized for the highest possible discount.
Security Reports
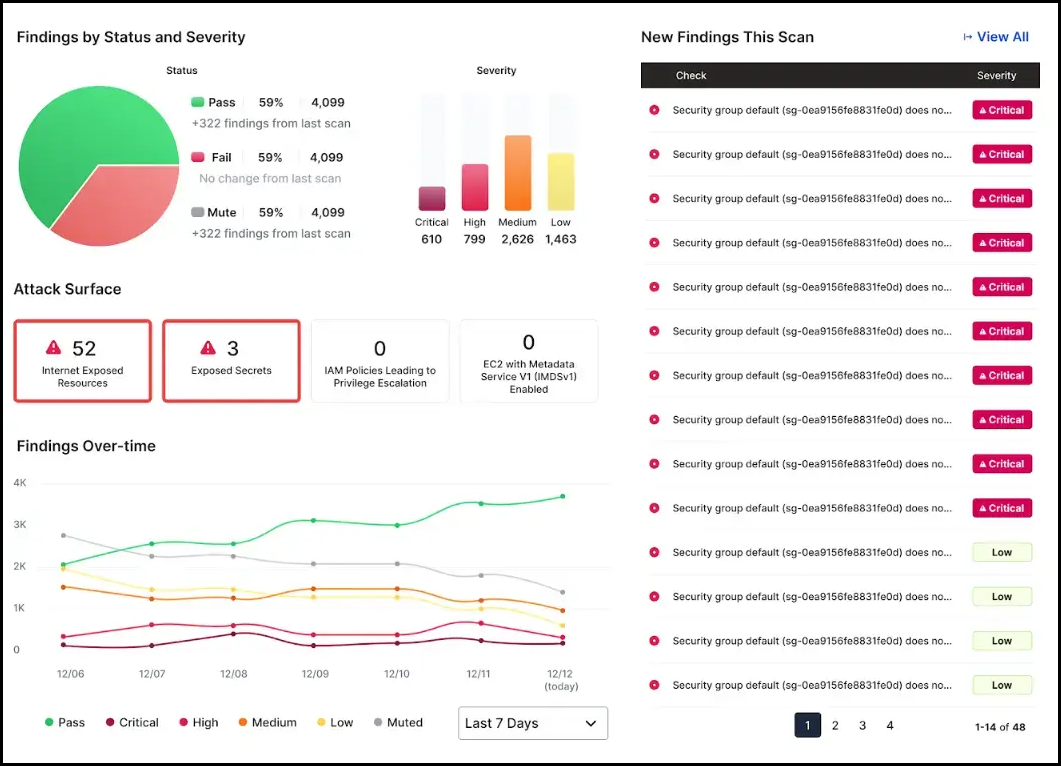
This dashboard ensures that your security posture is proactive, not just compliant. By ranking findings by severity and exposure, you empower your team to fix what matters most, protecting your infrastructure before a risk becomes a breach.
You get a roadmap that prioritizes your next three moves:
-
Neutralize the Attack Surface: Instantly identify and close the 52 internet-exposed resources and 3 leaked secrets that represent your highest immediate risk.
-
Focus on Critical Remediation: Cut through the noise of 5,000+ total findings to focus your engineering team exclusively on the 610 “Critical” vulnerabilities that threaten your core infrastructure.
-
Track Security Velocity: Monitor the “Findings Over-time” trend to ensure your team is resolving vulnerabilities faster than new ones are discovered.

This dashboard ensures that your security strategy is globally coordinated. By pinpointing exactly which regions and accounts are “lighting up” with new findings, you can deploy remediation resources where they are needed most, rather than guessing where the risk is.
You get a roadmap that prioritizes your next three moves:
-
Isolate Regional Hotspots: Use the global map to identify if a surge in “New” findings is concentrated in a specific geography like US-Central1, allowing you to investigate regional misconfigurations immediately.
-
Enforce Account Accountability: Rank your top 10 failed accounts by severity—such as Alias (primary) or DevE—to hold specific business units accountable for their individual security hygiene.
-
Identify Service Patterns: Analyze which core services, such as Cloudtrail or EC2, are responsible for the highest volume of failed checks (e.g., 12,234 fails) to address systemic architectural weaknesses.

This dashboard ensures that your compliance status is always current, not just a once-a-year effort. By bringing together all key frameworks in a single row of scorecards, you can demonstrate improvement to auditors and customers in seconds.
You get a roadmap that prioritizes your next three moves:
-
Audit-Ready Global Visibility: Instantly view your rating across CIS, SOC 2, ISO 27001, and HIPAA in one place, ensuring you meet the diverse requirements of your global customers.
-
Identify Compliance Drift: Spot immediate drops in your score, such as the -62% plunge in the “General Spanish Security National Scheme,” allowing you to investigate and fix recent environmental changes before an auditor finds them.
-
Track Remediation Progress: Measure the success of your engineering efforts with “Change from last scan” metrics (e.g., +12% improvements), proving that your organization is actively hardening its posture.
Deep-Dive Reports
With the Growth Package you don’t just get Cost Reports and Security Reports – you also get a set of deep‑dive analyses that connect the dots and turn insights into a concrete 90‑day plan.
-
Security Posture Assessment: Side‑by‑side scores for each AWS account, plus a risk and compliance register that highlights the biggest control gaps and recommended fixes.
-
Control Gap Analysis: Clear view of how your security, compliance, governance, and operations compare to your target state, so you can see exactly where to invest effort first.
-
90‑Day Implementation Roadmap: A phased plan that sequences quick wins, rightsizing, reserved instance changes, and security hardening into Month 1, Month 2, and Month 3.
-
Projected Savings Impact: Simple charts that show how each recommendation contributes to monthly and annual savings, so finance and engineering can align on the business case.
-
Cleanup Opportunities & Quick Wins: A prioritized list of unused or underused resources (idle instances, unattached volumes, old snapshots) with estimated savings and “High / Medium / Low” effort tags.
